What's New

Click to Subscribe

We Enhanced Our Platform!

Users can now easily download data for a chart, filter data in the main data download page, see the full list of metrics (click "BROWSE BY CATEGORY"), and other things!  We've also improved the platform's response time for rendering charts.  Please click here and let us know what you think!
New Infographic on Drug Overdose Deaths

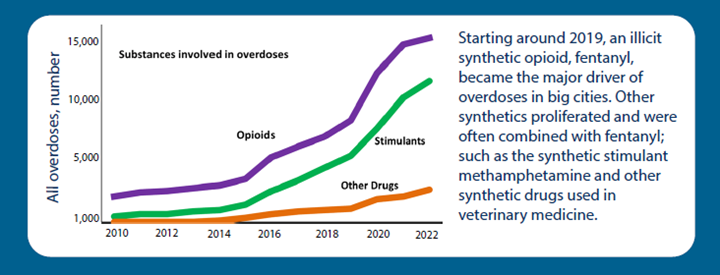
Our new infographic uses platform data from 2010 to 2022 and documents the lives lost due to synthetic drugs which are cheap and rapidly produced and available on streets across big cities. See our infographic here and our blog post advocating for treating drug use and dependence as a health and social issue, and strengthening surveillance and early warning systems.

New Data for 2022 and New Climate Metrics!!

The data platform was recently updated to include available data for all metrics spanning 2010–2022. Four new climate metrics were added that illustrate how extreme heat and disasters are impacting big cities. Learn more here.

Webinar: A Guided Tour of Our Platform

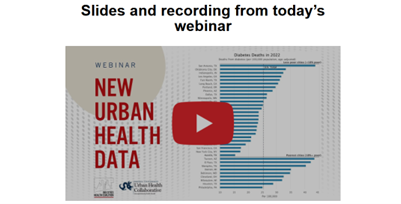
The Big Cities Health Coalition and Drexel University’s Urban Health Collaborative held a webinar on Friday May 17, 2024.  The webinar briefly oriented users to the new climate data on the platform and demonstrated features of the platform.  Click here for a recording of this event.

New findings: Homelessness Soars After Pandemic-Era Safety Net Programs End

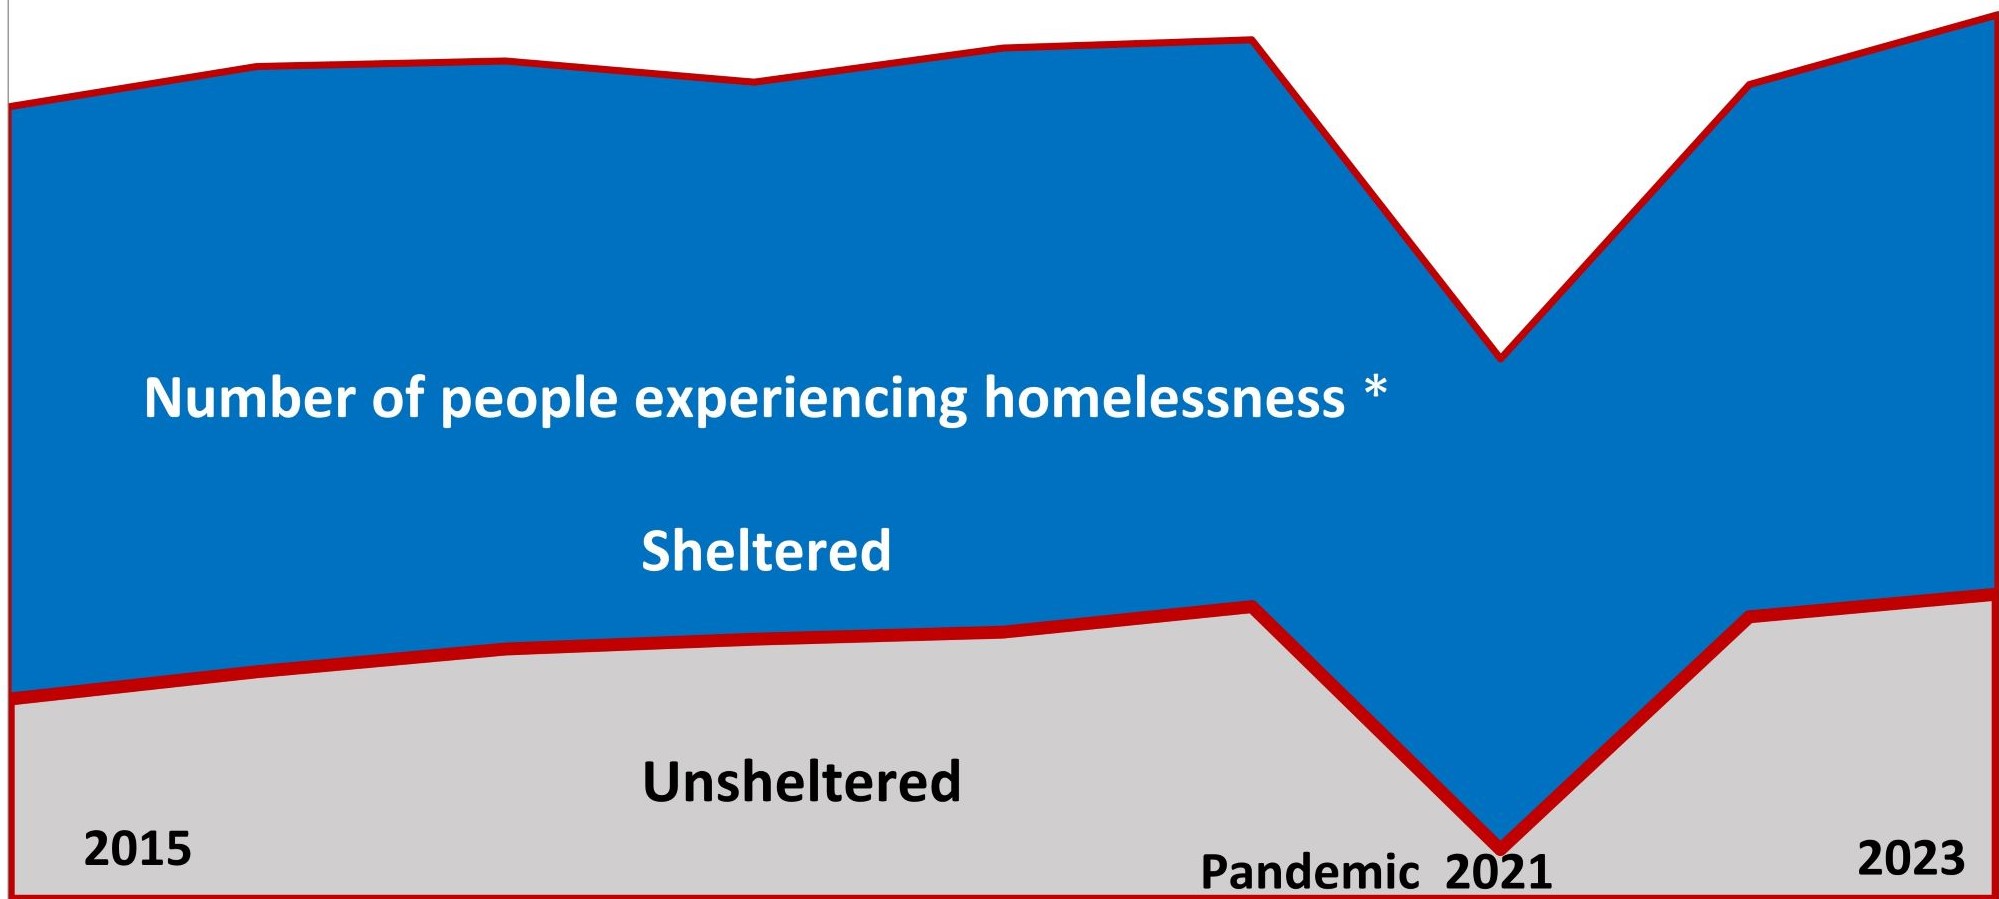
In BCHC cities, rates of people experiencing homelessness plummeted when pandemic-era housing safety net programs and policies were in effect but – after those phased out – rates of people experiencing homelessness rose to record levels. Learn more here.

New findings: Stark Racial Disparities in Vaccine Uptake and Flu-related Deaths

Platform data from 2021 showed that only 50% of older aged residents living in the nation’s largest cities received a flu vaccine. Among older aged Black residence, it was only 30%. Learn more here.

New Data Brief Published on Gun Deaths in Big Cities

In BCHC cities, lives lost to gun deaths rose 65% in the past twelve years, with huge increases during the height of the COVID-19 pandemic. Gun violence disproportionately claimed the lives of Black people and was highest in cities with higher poverty, unemployment, and racial segregation. Learn more from our blog post, infographic, and data brief.

New Infographic on Drug Overdose Deaths

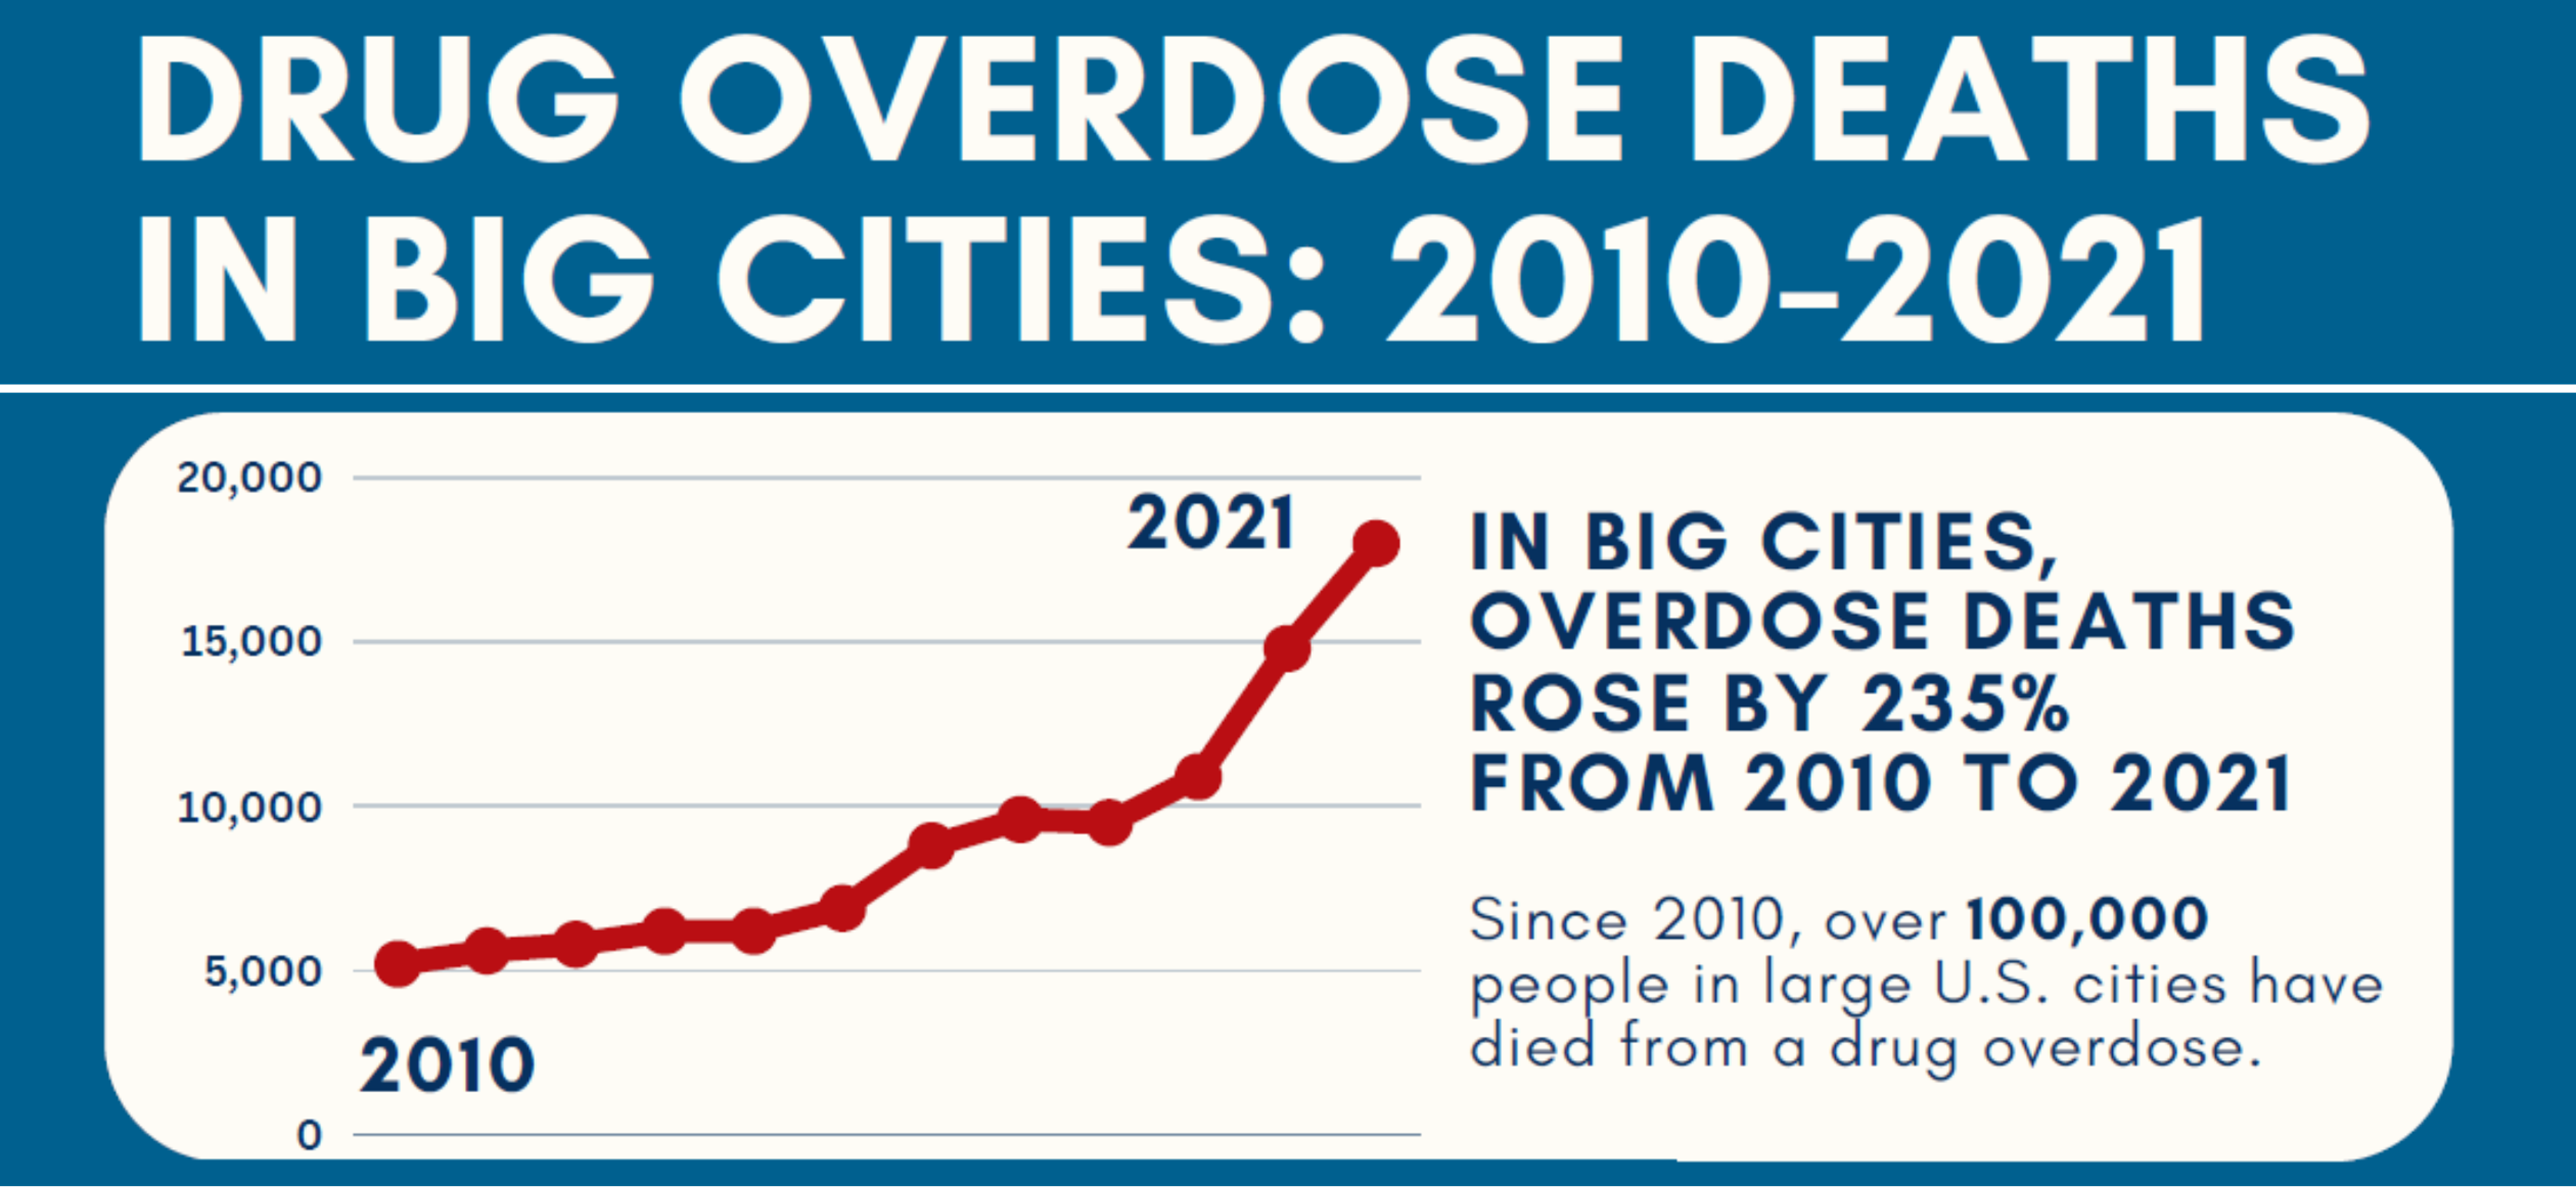
Our new infographic uses platform data from 2010 to 2021 and shows that in BCHC cities, lives lost to drug overdoses increased more than 3-fold in the past decade and that the largest increases were in the past two years. See our infographic here and our blog post advocating for the expansion of harm reduction programming here

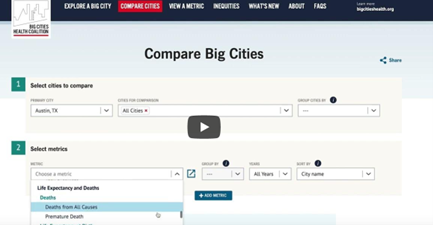
New Video Demo on the "Inequities" and "Compare Cities" Sections

This silent 1 minute video introduces users to a few features on the "Inequities" section and "Compare Cities" section. 

New Data for 2021 Now Available!!

The data platform was recently updated to include available data for all metrics spanning 2010–2021.  Five new metrics were also added: Preterm Births, Colorectal Cancer Deaths, Prostate Cancer Deaths, COVID-19 Vaccination Among Adults, and COVID-19 Vaccination Among Seniors.  Learn More

A newsletter with several items checked off

We'd welcome your feedback

Please answer 2-questions to help improve this data platform. Your information will not be shared.

Take survey